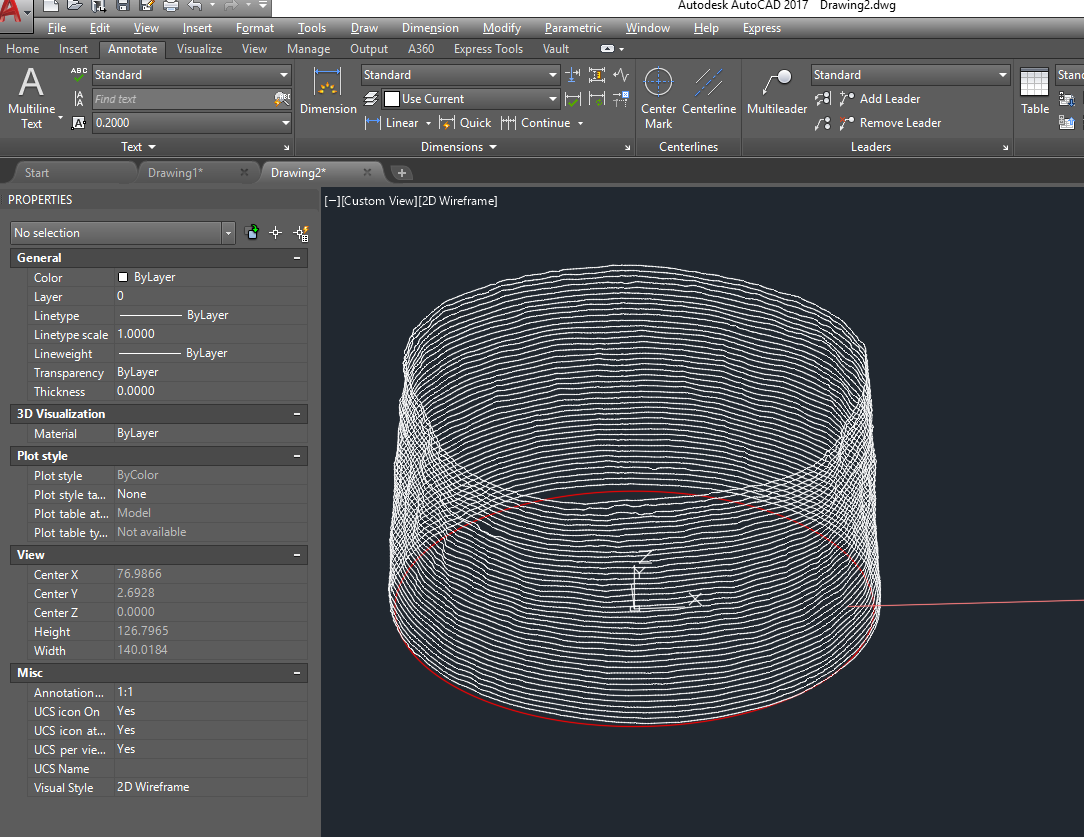
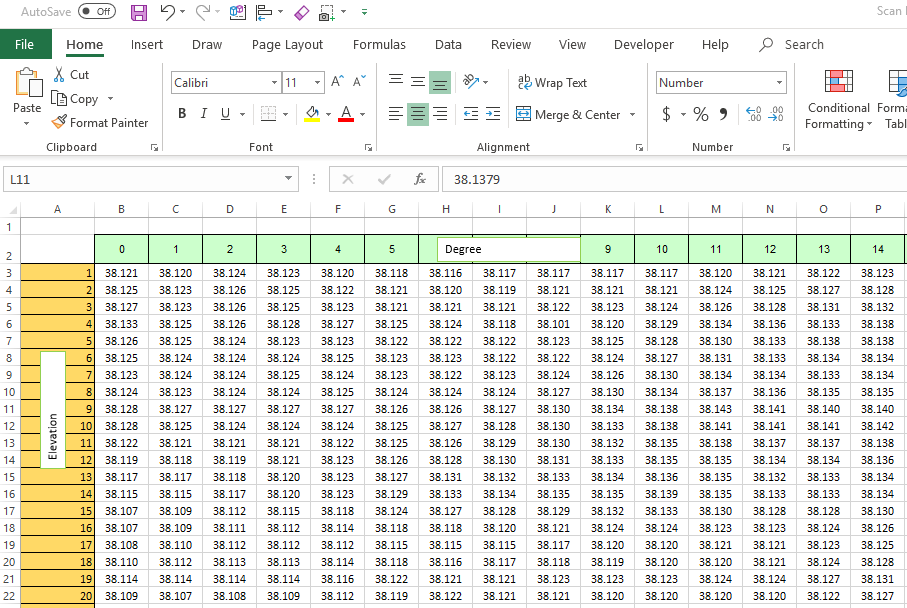
This example will grab scanned data from an excel file and create a visual representation of the scan data in AutoCAD by drawing splines. I haved uploaded the excel file for viewing reference Scan Data_to_Autocad.xlsm
Option Explicit
Public MTextObj As AcadMText
Public ACLayout As AcadLayout
Public acadApp As Object
Public acadDoc As AcadDocument
Dim lastrow As Long
Dim lastcolumn As Long
Dim irow As Long
Dim Circle_rad As Double
Dim pointarray() As Variant
Dim icol As Long
Dim iscale As Double
Dim splineObj As AcadSpline
Dim startTan(0 To 2) As Double
Dim endTan(0 To 2) As Double
Dim fitPoints() As Double
Dim inum As Long
Sub create_spline()
    Dim circleObj As AcadCircle
    Dim centerPoint(0 To 2) As Double
    'get the data and put into an array
    Circle_rad = 38.1
    With ThisWorkbook.Sheets("ScanData")
        lastrow = .Cells(Rows.Count, "B").End(xlUp).Row
        lastcolumn = .Cells(3, Columns.Count).End(xlToLeft).Column
        ReDim pointarray(2 To lastrow, 1 To lastcolumn)
        pointarray = .Range(.Cells(2, "a"), .Cells(lastrow, lastcolumn)).Value
    End With
    For irow = 2 To UBound(pointarray, 1)
        For icol = 2 To UBound(pointarray, 2)
            pointarray(irow, icol) = pointarray(irow, icol) - Circle_rad
        Next icol
    Next irow
    'open autocad
    On Error Resume Next
    Set acadApp = GetObject(, "AutoCAD.Application")
    If acadApp Is Nothing Then
        Set acadApp = CreateObject("AutoCAD.Application")
        acadApp.Visible = True
    End If
    If acadApp Is Nothing Then
        MsgBox "Sorry, it was impossible to start AutoCAD!", vbCritical, "AutoCAD Error"
        Exit Sub
    End If
    acadApp.WindowState = 3
    On Error GoTo 0
    On Error Resume Next
    Set acadDoc = acadApp.Documents.Add
    On Error GoTo 0
    acadDoc.ActiveSpace = 1
    acadDoc.SetVariable "OSMODE", 0  'remove the object snaps
    ReDim fitPoints(1 To (lastcolumn * 3))
    centerPoint(0) = 0: centerPoint(1) = 0: centerPoint(2) = 0
    Set circleObj = acadDoc.ModelSpace.AddCircle(centerPoint, Circle_rad)  'draw the true circle
    circleObj.Color = 1
    iscale = 25  ' this is the visual scale
    For irow = 2 To UBound(pointarray, 1)
        inum = 1
        startTan(0) = 0.5
        startTan(1) = 0.5
        startTan(2) = 0
        endTan(0) = 0.5
        endTan(1) = 0.5
        endTan(2) = 0
        For icol = 2 To UBound(pointarray, 2)
            fitPoints(inum) = (pointarray(irow, icol) * iscale + Circle_rad) * Sin(pointarray(1, icol) * 0.0174532)
            fitPoints(inum + 1) = (pointarray(irow, icol) * iscale + Circle_rad) * Cos(pointarray(1, icol) * 0.0174532)
            fitPoints(inum + 2) = pointarray(irow, 1)
            inum = inum + 3
        Next icol
        fitPoints(inum) = (pointarray(irow, 2) * iscale + Circle_rad) * Sin(pointarray(1, 2) * 0.0174532)
        fitPoints(inum + 1) = (pointarray(irow, 2) * iscale + Circle_rad) * Cos(pointarray(1, 2) * 0.0174532)
        fitPoints(inum + 2) = pointarray(irow, 1)
        Set splineObj = acadDoc.ModelSpace.AddSpline(fitPoints, startTan, endTan)
    Next irow
    ZoomAll
End Sub
